| Download The Data |
Data Set #078
|
|
|
|
 |
|
| About the Data | ||
| View the Data | ||
| Help with Using Data |
| Go to Top | ||
|
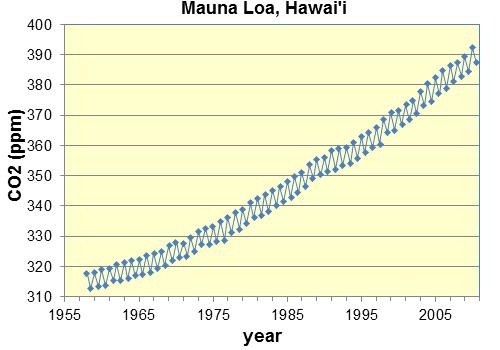
About the Data The carbon dioxide (CO2) content of the atmosphere at the Mauna Loa Observatory on the Big Island of Hawai'i has been measured continuously since 1958. Mauna Loa is an excellent site for determining atmospheric CO2 content because of the geographic isolation of the Hawaiian Islands and because of the high elevation (3400 meters or 11,000 feet above sea level) of the sampling equipment. The site yields high quality, monthly data for the CO2 concentration in the atmosphere of the Northern Hemisphere (see reference below). We have extracted the "interpolated" values for April and October for each year, corresponding (approximately) to the maximum and minimum concentrations of CO2 in a calendar year. The data show both a cyclic behavior and an exponential trend. The oscillatory behavior corresponds to a yearly cycle of increasing atmospheric CO2 from late fall to spring, with a maximum in April, and then decreasing atmospheric CO2 from spring to late fall, with a minimum in October. The simple interpretation is that carbon dioxide is "scrubbed" or removed from the atmosphere of the northern hemisphere during the spring-summer growing cycle, when green plants suck up CO2 during photosynthesis. Carbon dioxide is then released during fall and winter, when plants die and rot. The exponential increase of CO2 with time is related to an exponential increase in fossil fuel consumption since the Industrial Revolution, with occasional oceanic contributions due to changes in sea surface temperatures associated with currents like El Nino. Burning of fossil fuels (coal and petroleum by-products) releases tremendous quantities of carbon dioxide. Students could find the exponential model for these data in various ways (two-point method, calculator-based regression), then subtract that exponential increase from the data to isolate the cyclic behavior. The cyclical data could then be modeled with simple sinusoidal functions, knowing that April and October represent the maximum and minimum values of CO2 in a calendar year. For a more complete data set which includes both the original and interpolated month-by-month measurements, open the Full Data Set For an additional discussion of using month-by-month measurements, visit DataSet #016. A special thanks to Dr. Andrew Long, Department of Mathematics and Statistics Northern Kentucky University, for providing this complete data set! Data source: C.D. Keeling and T.P. Whorf, Carbon Dioxide Research Group,
Scripps Institution of Oceanography, University of California, La Jolla,
California.
|
||
| Go to Top | ||||||||||||||||||||||||||||||||||||||||||||||||||||||||||||||||||||||||||||||||||||||||||||||||||||||||||||||||||||||||||||||||||||||||||||||||||||||||||||||||||||||||||||||||||||||||||||||||||||||||||||||||||||||||
| View the Data | ||||||||||||||||||||||||||||||||||||||||||||||||||||||||||||||||||||||||||||||||||||||||||||||||||||||||||||||||||||||||||||||||||||||||||||||||||||||||||||||||||||||||||||||||||||||||||||||||||||||||||||||||||||||||
|
||||||||||||||||||||||||||||||||||||||||||||||||||||||||||||||||||||||||||||||||||||||||||||||||||||||||||||||||||||||||||||||||||||||||||||||||||||||||||||||||||||||||||||||||||||||||||||||||||||||||||||||||||||||||
| Go to Top |