About Atmospheric Pressure and Altitude
The atmosphere is mostly composed of nitrogen (N2), oxygen (O2), argon,
water vapor, carbon dioxide and other gases. The Earth's gravitational pull works on atmospheric gases such that
the atmosphere is most dense nearest the ground and decreases in density with altitude. The atmosphere is very
"thin" (low in density) at the summit of Mt. Everest, and supplemental oxygen must be used by many individuals
to compensate for the lack of molecular oxygen in the atmosphere.
The pressure exerted by the atmosphere increases as the ground is approached, due to the
increasing cumulative weight of the gas molecules that make up the atmosphere. Think of diving to the bottom of
a swimming pool; as you go down, the column of water above you exerts more and more pressure. The pressure exerted
by a typical column of atmospheric gas is 1 atmosphere (by definition!), which is approximately 1.013 bar or 1013
millibars (1013 mb).
For solids and liquids, pressure as a function of height (or depth or thickness) is given
by a decreasing linear relationship, P = -dgh, where P is pressure, d is density, g is the acceleration of gravity
(about 10 meters per second squared) and h is height. The linear relationship assumes a constant density, which
is true for many liquids and solids over short depth intervals. Most solids and liquids are nearly incompressible
over small pressure changes; they do not change volume (change density) upon being compressed. Another way to state
the decreasing linear relationship is that the rate of change of pressure with respect to height is a negative
constant, or dP/dh = -dg .
Gases, on the other hand, are highly compressible, and will increase in density with increasing
pressure. In theory, the relationship between density and pressure is linear, so d = k1P. Now make the
substitution into the last equation of the paragraph above and obtain: dP/dh = -k1gP = -kP (for k =
k1g). In words, the change in pressure with respect to height (at any given height) is negatively proportional
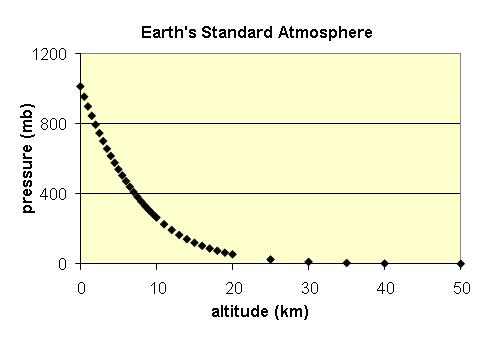
to the pressure (at that height). Integrating each side of the last equation yields the formula for pressure as
a function of height: P = P0e-kh. In this equation P0 is the pressure at height
h = 0, k = k1g, and e is Euler's constant » 2.718281828.
The "data" given in the table are not actual measurements of atmospheric pressure,
but instead are values produced from the exponential model (formula) of pressure as a function of height given
above. The "data" show no scatter and return an absurdly high R value upon regression. We hope to substitute
actual measurements for these model values shortly.
Reference: Arguado E and Burt JE (1999), Understanding Weather and Climate; Prentice Hall, Saddle River, New
Jersey.