ABOUT LAVA DOME GROWTH AT MT. ST. HELENS VOLCANO
Mt. St. Helens, a stratovolcano in the Cascade Range of Washington State, erupted violently on 18 May 1980.
The giant landslides and subsequent eruption created a large, horseshoe shaped crater. A dome shaped "bunion"
of dacite (a pale volcanic rock) began to form in the crater shortly after the initial eruption. The lava dome
grew for the next few years, in short episodes often accompanied by small eruptions. It was expected that the dome
would eventually fill the entire crater and rejuvenate Mt. St. Helens but dome growth stopped in the mid 1980's
and the volcano has been very quiet since.
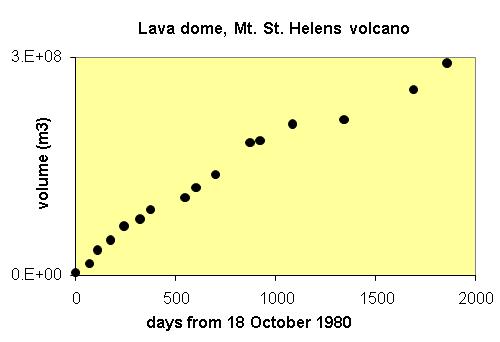
An approximate volume of the dome in cubic meters was calculated using measurements of the dome's length, width
and height, assuming a rectangular paralleopiped. This geometry overestimates the actual dome volume but maintains
a self consistent approach (the shape of the dome has also changed with time).
The rate of lava dome growth has decreased with time, as discussed above. This type of growth can be modeled
with a power law with the exponent less than unity. The student will encounter a problem immediately with the first
data point and will have to devise a reasonable solution. The power law "decay" of growth rate might
reflect incremental tapping of a finite magma reservoir or incremental decrease in material available for melting
at depth.
The best fit power law regression to the data gives a reasonable correlation coefficient, however the shape
of the best fit regression looks nothing like the actual data, "missing" every data point except two.
Students should try their own power law models, using various combinations of the initial value and exponent, to
generate a curve whose shape and position corresponds more closely to the data. The students can then be challenged
to explain why their better looking curves represent a poorer fit; what are the sums of the squares of the deviations
in both cases, and what is the source of the "problem"?
Reference: the unsourced data was found on a geology website at Green
River Community College. We're still tracking down the original data.