Data Home | Math Topics | Environment Topics | Topics Matrix | Master List | Help

Download the Data

PDF

Excel File

Text File

Minitab File

Data Set #010

About the Data
View the Data
Help with Using Data

  Go to Top  

About the Data

ABOUT COLUMBIA RIVER VELOCITY HISTOGRAMS

    Current velocities were measured on a number of transects across the Columbia River in Washington State, to understand how velocity varies within a channel. The velocity at any point in a river is controlled by a number of factors, including the river's slope or gradient, roughness of the channel bed, turbulence of the flow, depth of the river, etc. Typically, water moves faster away from the bed of the river, where obstacles create drag and turbulence. The highest velocity overall is usually in the deepest part of the channel, just below the surface.

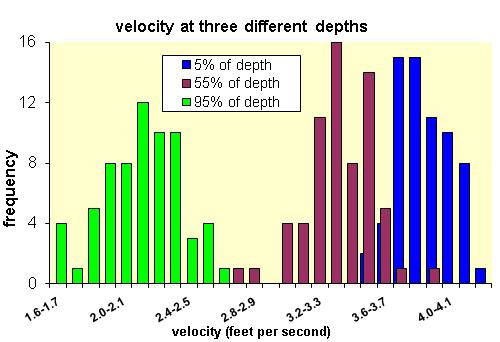
    Data on the variation of velocity with time at 3 different depths were obtained along a transect below Priest Rapids Dam on the Columbia River in Washington State. Velocities were measured every minute for 66 minutes. Even though all other variables are fixed, velocity still varies with time as the current surges and wanes. Knowing the mean velocity in a channel is extremely important when calculating river discharge, the volume of water flowing past in a given amount of time. The data emphasize the importance of thorough measurement.

    The histograms and accompanying statistical parameters show some interesting patterns. Mean velocity decreases with depth, as expected. Roughness of the bed has a strong influence on velocity, due to both drag and turbulence. The standard deviation increases with increasing depth, perhaps reflecting this increasing turbulence.

    Reference: Savini, J. and Bodhaine, G. L. (1971), Analysis of current meter data at Columbia River gaging stations, Washington and Oregon; USGS Water Supply Paper 1869-F.

     
  Go to Top  

View the Data

Savini and Bodhaine (1971), USGS WSP
Columbia River below Priest Rapids dam, 14 Aug 1963
velocity (ft per sec) at a fixed point measured every minute for an hour
velocity measured at various depths (given in % of total depth)

5% of total depth


55% of total depth


95% of total depth


time (min.)

velocity


time (min.)

velocity


time (min.)

velocity

1

3.96


1

3.50


1

2.28

2

4.00


2

3.24


2

2.03

3

4.14


3

3.06


3

1.66

4

4.11


4

3.42


4

2.10

5

3.82


5

3.39


5

2.06

6

3.96


6

3.31


6

1.70

7

4.07


7

3.46


7

1.95

8

4.04


8

3.57


8

2.39

9

3.85


9

3.13


9

1.95

10

3.82


10

3.20


10

1.66

11

3.71


11

3.02


11

2.14

12

4.14


12

3.31


12

1.92

13

3.78


13

3.28


13

2.17

14

3.56


14

2.72


14

1.62

15

3.74


15

2.87


15

1.84

16

3.96


16

3.53


16

2.32

17

3.78


17

3.36


17

2.17

18

3.74


18

3.17


18

1.62

19

3.78


19

3.24


19

2.14

20

3.82


20

3.35


20

2.36

21

3.78


21

3.06


21

2.03

22

4.07


22

3.46


22

2.10

23

3.74


23

3.13


23

1.88

24

3.71


24

3.42


24

2.14

25

4.04


25

3.50


25

1.81

26

4.22


26

3.39


26

2.06

27

3.89


27

3.57


27

2.32

28

3.96


28

3.76


28

2.32

29

3.89


29

3.64


29

2.50

30

3.89


30

3.28


30

2.03

31

4.11


31

3.68


31

2.21

32

3.78


32

3.46


32

2.21

33

3.56


33

3.31


33

2.25

34

3.74


34

3.02


34

2.06

35

3.96


35

3.35


35

1.84

36

3.82


36

3.35


36

2.17

37

3.67


37

3.31


37

2.50

38

3.78


38

3.17


38

1.95

39

3.82


39

3.42


39

2.21

40

3.96


40

3.28


40

2.25

41

3.93


41

3.28


41

2.43

42

4.18


42

3.94


42

2.50

43

3.93


43

3.50


43

2.39

44

4.04


44

3.50


44

2.32

45

4.00


45

3.50


45

2.06

46

3.93


46

3.53


46

1.95

47

4.18


47

3.46


47

2.47

48

3.85


48

3.24


48

2.10

49

3.85


49

3.50


49

2.14

50

3.93


50

3.61


50

2.43

51

3.89


51

3.50


51

2.21

52

3.67


52

3.35


52

1.92

53

3.63


53

3.28


53

1.88

54

3.85


54

3.57


54

2.14

55

3.96


55

3.42


55

2.36

56

4.14


56

3.61


56

2.21

57

3.85


57

3.35


57

1.99

58

4.00


58

3.53


58

2.58

59

4.18


59

3.31


59

2.32

60

4.07


60

3.50


60

2.28

61

3.74


61

3.35


61

1.99

62

3.71


62

3.35


62

2.14

63

3.85


63

3.68


63

2.61

64

3.71


64

3.24


64

2.03

65

3.63


65

3.35


65

2.39

66

4.00


66

3.24


66

2.28

N

66


N

66


N

66

minimum

3.56


minimum

2.72


minimum

1.62

maximum

4.22


maximum

3.94


maximum

2.61

mean

3.89


mean

3.37


mean

2.14

std dev

0.16


std dev

0.20


std dev

0.24

  Go to Top