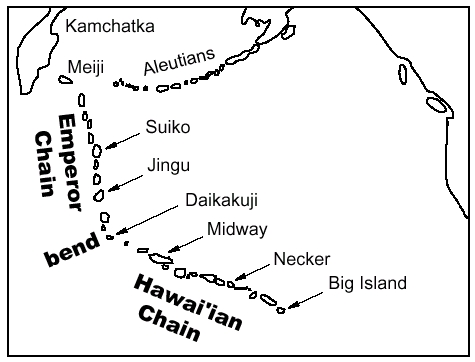
About the Hawai'i-Emperor Chain:
The Hawai'i-Emperor chain of seamounts (volcanoes
resting on the ocean floor) stretches from its active end at the Big
Island of Hawai'i west and north across the Pacific Ocean floor to
the Aleutian trench near the Kamchatka Peninsula (first figure). There
are about 110 individual volcanoes in the Hawai'i-Emperor chain (see
the data table), which is about 6000 km (3800 miles) long altogether.
The Hawai'i-Emperor chain is divided into two segments, the WNW-trending
Hawai'ian chain and the N-trending Emperor chain. The two chains meet
at a prominent bend, around the underwater seamounts Daikakuji and
Yuryaku.
The active end (youngest end) of the Hawai'i-Emperor
chain is at the Big Island of Hawai'i and the offshore, still underwater
volcano Loihi. Kilauea volcano on the Big Island is active today,
and other centers on the Big Island and on Maui have erupted recently.
As one progresses towards the west-northwest, the volcanoes of the
Hawai'ian Islands get progressively older (see data table). Once active
volcano building through eruptions of lava ceases, the erosional forces
of tropical weathering, landslides, river erosion, and wave action
overcome the island, and erodes it down to sea level (second figure).
The extinct volcano evolves to a flat-topped mesa ringed by coral
reefs, and then to an atoll with nothing but the circular reef showing.
Finally the volcano sinks beneath the waves, and becomes an underwater
seamount.
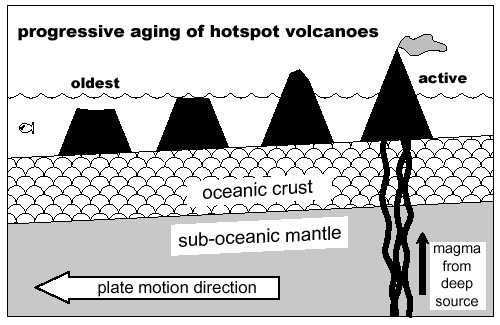
The Hawai'i-Emperor chain is a classic example
of a hot spot track. The standard explanation begins with a hot spot
whose source of magma is rooted deep in the Earth's mantle. The hot
spot magma source is thought to be fixed in the deeper mantle, with
a slab of ocean crust and uppermost mantle (called a plate) moving
laterally above the hot spot. As the Pacific Plate moves over the
Hawai'ian hot spot, magma punches up through the Pacific Plate, creating
an active volcano. Plate motion carries the active volcano away from
the magma source, the volcano goes extinct, and a new volcano grows
over the hot spot. As the extinct volcano is carried farther and farther
from the hot spot source, the volcano sinks beneath the waves mostly
due to aging and cooling of the ocean crust underneath the extinct
volcano; this cooling causes subsidence of the ocean floor.
Hot spot tracks are very important geologic features
for determining both the direction and speed of the plate upon which
the seamounts rest The direction of plate motion is given by the orientation
of the chain of seamounts and volcanoes. Using your "hands of
science", you can quickly determine that the plate "moves
towards the oldest volcano." As can be seen in the first figure,
the Pacific Plate moved almost due north during "Emperor time"
(from 75 to 42 million years ago), and then changed direction about
42 million years ago (the age of the volcanoes at the bend in the
chain), to move west-northwest during "Hawai'i time" (from
42 Ma to the present). Note that the azimuths cited here assume no
rotation of the Pacific Plate during the last 75 Ma.
Hot spot tracks also give the speed of plate motion,
if the length of the chains of volcanoes and seamounts, and the ages
of the volcanoes and seamounts are known (data table). Plates typically
move about 1-10 cm/year, which is equivalent to 10-100 km/Ma (kilometers
per million years). These speeds are about the rates at which fingernails
grow, and may seem rather slow on the human time scale, but are very
fast on the geological time scale. The Earth is 4.55 billion years
old; one million years is a brief moment in Earth time. The speed
of the North American plate (for example) is fairly typical for plates,
about 6 cm/year, whereas the Marianas plate is one of the fastest
(today), moving about 13 cm/year.
Distances from the active Kilauea volcanic center
(measured parallel to the Hawai'i-Emperor chain) and ages of each
volcano and seamount are given in the data table (Clague and Dalrymple
1989). These data have been compiled from a wide variety of sources
and researchers, which can introduce uncertainties. For example, different
geochronologic laboratories determined the ages of the volcanic rocks
from these seamounts, and different labs often use different machines,
different standards, and different analytical techniques. Even with
the highest quality of work, the ages have uncertainties which vary
from sample to sample. Furthermore, volcanoes do not have a single
age; a typical Hawai'ian volcano builds up over half a million years
or more. Who is to say that the volcanic rocks dredged up from the
underwater seamount Jingu (for example) are representative of Jingu's
eruptive history? It is very difficult to sample Jingu's older rocks;
they are covered by the young lavas. The data in the table are not
without problems, and students should not simply accept the data at
face value.
For the first part of their exercise, students
can fit both a constrained (through the origin) and an unconstrained
linear regression to the entire Hawai'i-Emperor chain, to find the
"typical" rate of Pacific Plate motion over the last 65
Ma. Students can do this graphically (with a ruler) or numerically
using Excel or a graphing calculator. Students should be encouraged
to include the units of slope and intercept in their equations, and
explore and affirm that these parameters have real, physical meaning.
As will be seen, both the unconstrained and constrained regressions
have very high correlation coefficients. There are a number of questions
that could be asked of the students. What are the units of both the
rate and the Y-intercept? How would you write the equations using
centimeters and years for units? How does the "typical"
rate of the Pacific Plate (in cm/year) compare with the Marianas and
North American Plates? Must the Y-intercept be zero? Is the Y-intercept
unacceptably large or is it reasonably small?
For the second part of their exercise, students
can fit unconstrained regressions to both the Hawai'i chain and the
Emperor chain separately. Has the Pacific Plate sped up or slowed
down over the last 65 Ma? Students with more advanced statistics backgrounds
can be asked whether the two regressions are significantly different,
and at what confidence level. Even more advanced students can incorporate
the errors in either the ages, the distances, or both, to calculate
a more robust regression.
A change in speed from the older part of the chain
to the younger part of the chain seems reasonable from the data. All
students should then be asked: must a change in speed accompany a
change in direction? Must this change in speed happen exactly at the
bend, 42 Ma ago? How could we determine when this change in speed
actually took place?
Data Source: Clague DA and Dalrymple BG (1989),
Tectonics, geomorphology and origin of the Hawaiian-Emperor volcanic
chain; in Winterer EL, Hussong DM and Decker RW (eds.), The Eastern
Pacific Ocean and Hawaii; Geological Society of America, Boulder,
Colorado; The Geology of North America, Volume N, pp. 188-217.
