About cyclical electric consumption
The use of electricity by municipalities varies throughout the day in a cyclic or periodic
fashion. Energy use is lowest in the early morning and peaks at the breakfast and dinner/evening hours when energy
sapping activities such as heating, cooking, washing and lighting (using resistance devices) are in full swing.
Superimposed on this daily variation are trends in energy consumption reflecting changes in the weather (heating
or air conditioning), longterm net changes in energy efficiency, etc.
The diurnal variation in energy consumption can present challenges to utilities, which must
design production and delivery systems that can handle peak loads much higher than the mean load. In addition,
it may not be possible to adequately curtail the energy generation system during the early morning hours of low
consumption; hard to shut down nuclear power plants and hydroelectric dams for a few hours. Energy utilities often
lower their rates for off-peak usage, to encourage consumption of otherwise somewhat "wasted" energy.
Pumped hydrostorage facilities take advantage of these price differentials, to create potential energy during off
peak hours when energy costs are low, and then to release that potential energy during peak hours when costs are
high, thereby generating a profit despite a net loss in system energy.
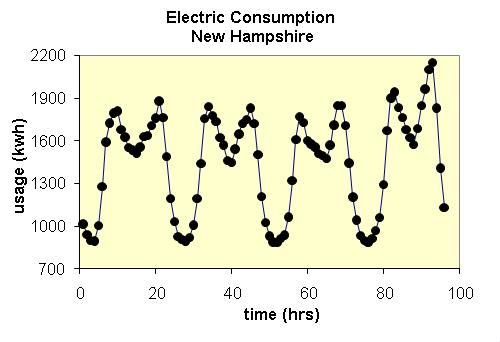
The data in the table and graph represent 4 days of electric usage from one delivery point
in New Hampshire at the end of August, 1997. The consumption values (in kilowatt-hours) also include losses of
electricity in the distribution system (transmission lines are not 100% efficient). The diurnal cyclic behavior
dominates the data, however the numbers are not completely sinusoidal; electricity consumption drops around mid-day
to early afternoon. Why? The lowest consumption rate seems constant over this 4 day period, but the 4th day's maximum
usage (September 1, 1997) seems much higher than the previous 3 days. What might have caused this spike?
The data could be modeled with a simple sinusoidal function of ø. Students must choose
a midpoint in the cyclic data for ø = 0, and a value for the maximum (or minimum) difference from the midpoint;
some iteration will be required. Are the data symmetric like a sinusoidal function, or is there some asymmetry
to the data? The residuals from the model might prove interesting.
Reference: data from the New Hampshire Electric Co-Op
http://www.nhec.com/index.html