About the frequency of large earthquakes
Earthquakes (ground shaking) are caused by relatively fast movement along breaks in the Earth's
crust, known as faults. In general, the more movement or displacement along a fault during an event, the greater
the amount of ground shaking. Ground shaking is also affected by the properties of the Earth materials through
which the vibrations pass; weak soils or loose sediment can enhance ground shaking.
There are several different methods of measuring the size of an earthquake; a popular measure
of earthquake size is the Richter magnitude. The Richter magnitude is based upon the amplitude (height) of ground
shaking as recorded on a machine (a seismometer). Earthquakes vary in size over many orders of magnitude, and therefore
the Richter scale is logarithmic to accommodate this wide variation in earthquake sizes. On the logarithmic Richter
scale, a magnitude 7 earthquake is 10 times bigger than a magnitude 6 earthquake. Earthquakes that are magnitude
7 or above are often (though not always) very damaging earthquakes.
The United States Geological Survey has compiled information on the number of earthquakes
around the globe that have equaled or exceeded magnitude 7. The data are expressed as the number of earthquakes
per year for each year starting in 1900. Note that the older data in this table are somewhat suspect, because seismometers
did not systematically record earthquakes in a standardized fashion with good spatial coverage until the 1930's
or later.
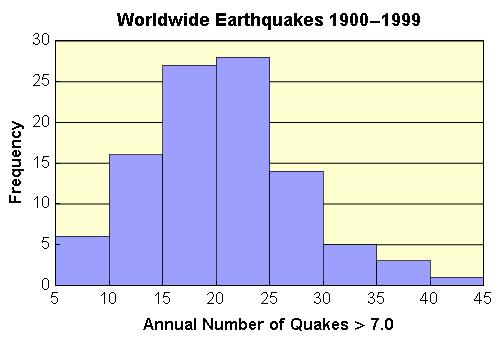
What is the recurrence interval for large earthquakes globally? How often do large earthquakes
occur? These questions are fundamental to understanding the impact of earthquakes on the human population. We can
better visualize the data using a histogram of the frequency of large earthquakes per year. This particular graph
is a little challenging, as it shows the frequency of rates of earthquakes.
The data are unimodal, with a mean around 20 large earthquakes per year on Earth. There is
a wide variation in earthquake rate, from a low of 6 quakes per year in 1986 to a high of 41 quakes per year in
1943. The distribution of earthquake rates is skewed slightly to the right.
Students could be queried also about the temporal variation in large earthquakes. General
information on earthquakes can be found at the US Geological Survey's website: http://www.usgs.gov/
.
Reference: United States Geological Survey, published in the New York Times. We haven't found the ultimate source
yet.