About MTBE, BTEX and LUST
Methyl tertiary-butyl ether (MTBE) is a volatile organic compound (VOC) commonly added to
gasoline to improve combustion, enhance engine performance, and lower tailpipe emissions; up to 15% of gasoline
by volume may be MTBE. As a groundwater or soil contaminant, MTBE is usually associated with other organic compounds
such as benzene, toluene, ethylbenzene and xylene (aka BTEX). Contamination of groundwater by MTBE is caused by
gasoline spills at refineries and gas stations, and by leaking underground storage tanks (LUST). MTBE is readily
dissolved in water, has high mobility, and does not biodegrade easily, making MTBE a particularly difficult contaminant.
In addition, MTBE is a suspected carcinogen. A "safe level" of MTBE in drinking water has not been established,
however some states, including Washington State, have proposed cleanup levels of MTBE around 20 ppb (parts per
billion or microgram per liter).
Washington State's Department of Ecology measured MTBE and BTEX at 70 LUST sites around the
state, using groundwater samples taken from monitoring wells. We have chosen MTBE and benzene from the larger data
set for comparison, have ignored sites where one of the compounds was not detected or measured, and have ignored
analyses that did not report an absolute concentration (e.g. > 10 ppb or <33 ppb). The maximum concentration
of MTBE at the remaining sites was 7150 ppb, while the maximum concentration of benzene was 5680 ppb; both values
are extreme.
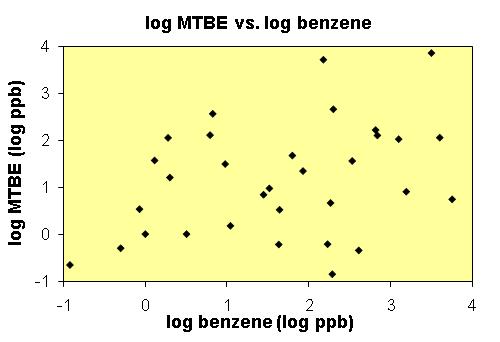
To test the hypothesis that groundwater contamination
by organic compounds at these sites was caused by spillage or leakage
of gasoline, one might compare the concentration of MTBE with the
concentration of benzene in the groundwater sample. If these two contaminants
had the same source (gasoline), and if these two contaminants had
some fixed ratio in the gasoline, then they should be correlated in
the groundwater; the more benzene, the more MTBE. The values of MTBE
and benzene range over about 5 orders of magnitude, making them difficult
to compare on one graph. Logarithms of both measurements were calculated
and are displayed on the scatterplot. As is apparent visually, there
is little to no correlation. Students can practice their regression
techniques to confirm and quantify the lack of correlation.
The simple conclusion is that MTBE and benzene in groundwater at these sites are coming from
different sources; the hypothesis failed the test. However, groundwater contamination and sampling are not so simple.
MTBE might migrate faster than benzene, causing changes in the ratio of these two contaminants with time and distance.
Only one monitoring well at each site was sampled; perhaps this well missed the main part of the contaminant "plume."
Benzene might evaporate faster than MTBE. And some of the caveats to the original hypothesis may be incorrect;
what are the initial concentrations of benzene and MTBE in different kinds of gasolines? Is MTBE used in gasoline
in Washington State?
Reference: Amoah-Forson, B. (2000), Occurrence of methyl tertiary-butyl
ether (MTBE) in groundwater at leaking underground storage tank sites
in Washington; Washington State Dept. of Ecology Publication 00-09-054,
23 pp.
http://www.ecy.wa.gov/biblio/0009054.html