About the population pyramid and data
Population pyramids are commonly used by
demographers to illustrate age and sex structure of a country's population.
Countries that are expected to grow rapidly typically have a large
number of individuals in their reproductive years and the population
pyramid is wider or"heavier" at the bottom. In contrast, populations
that are expected to have slow, zero, or negative growth typically
have more individuals beyond reproductive age, and their pyramids
tend to be "top heavy". Population distributions of the United
States (moderate growth) and Germany (negative growth) can be found
in QELP data sets #031
and #033
, respectively.
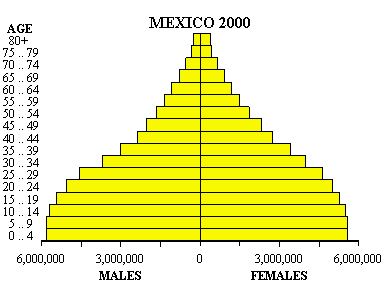
The population distribution of Mexico is quite
different from that of the US and Germany in that over 50% are under
age 25. Even more significant is the fact that 33% of
the current population of women are of pre-reproductive age
(0-14 years) and 49% of reproductive age (15-44). With a such
large proportion of young females, Mexico's population is expected
to rapidly increase in the near future. Some demographers classify
Mexico as a transitional country, moving from a farm based
to an industrial based economy. In more industrialized economies,
birth rates drop (for reasons including better access to family planning
and increased job opportunities for women) and eventually approach
death rates. As these rates converge, overall population
growth decreases. As Mexico becomes more industrialized will
its population growth approach zero? Will the total population
eventually level off?
Making predictions about a country's future population
is aided by studying age cohorts (groups) such as those defined in
the accompanying data set. Instead of considering a single growth
or birth rate for the entire population, demographers estimate each
cohort's birth and death rate, so as to increase the predictive power
of their models. Also taken into consideration are immigration
and emigration from each cohort to other countries. (For Mexico,
emigration is significant among males of working ages as many relocate
to the United States to work.) Using dynamic cohort models,
population pyramids can be computed predicting population structural
changes over time. For an example of these pyramids visit the
extraordinary website http://www.census.gov/ipc/www/idbpyr.html.
This site is part of the much larger US Census International Data
Base (IDB) website where additional country by country demographics
can be found.
Source of the Data: US Census http://www.census.gov/