An excellent mathematical problem is to determine annual runoff per unit area given data
on mean annual flow and drainage area. It is simple enough to do this by dividing mean annual flow by the
drainage area. Complications arise in this data set since different units of length and time must be accounted
for. Mean annual flow or runoff is often expressed in acre-feet per year, especially when the water is to
be used in agriculture. Note: 1 acre = 43560 ft2, 1 acre-foot = 43560 ft3.
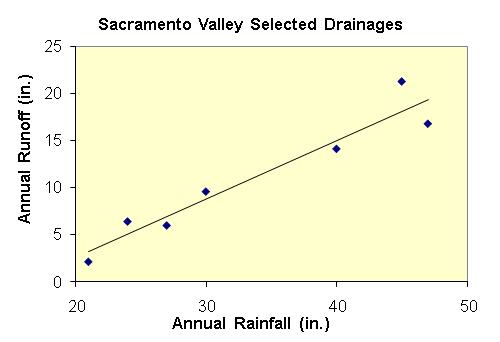
The best fitting linear regression equation is : R = 0.619P - 9.82 where R is annual
runoff per unit area, in inches, and P is annual precipitation (rainfall), in inches. So what does this equation
tell us? The slope of the equation tells us that for every 1 inch increase in precipitation (per unit area),
there is a 0.619 inch increase in runoff (per unit area). In other words, 61.9% of the precipitation flows
out of the drainage basin as runoff.
This begs the question, "What happens to the other 38.1%?". In the Sacramento Valley
(hot and dry most of the year), much of the lost water is probably due to evaporation (from the ground, from reservoirs,
and from the air as it is sprayed on crops). Water loss can also be due to transpiration, the process by
which water is "expired" out of plants as a gas, and through percolation into an underground aquifer.
No information about the Sacramento valley's hydrological cycle was provided with the source data.
The regression equation's vertical intercept is -9.82 inches, which is a bit difficult to interpret.
Probably more meaningful for students is the horizontal intercept or P- intercept. By setting R = 0 and solving
for P, we find that the P intercept is 15.86. This tells us that only after 15.86 inches of precipitation
is there positive runoff. Students should question and discuss the validity of this number in
light of the fact that it is based upon annual averages and only 7 data points.
We can think of the precipitation-runoff data from the 7 drainage basins as a sample
of all precipitation-runoff data from a larger population of drainage basins. (The population might
equal all drainage basins in Sacramento County, for example.) A question that arises in statistics is, "If
there is correlation in the sample data, how confident are we that there is correlation in the population data?".
Assuming that you want to answer this question at some level of confidence, correlation ranges can be found in
introductory statistics texts. For example, to operate at the 95% confidence level with 7 data points,
we can read from a table that the r value should be greater than 0.75. The correlation coefficient
for the 7 data points in this sample is approximately r = 0.96, thus we can say that we are at least 95%
confident that there is correlation in the population. (A more precise statistical statement of this fact
requires knowledge of hypothesis testing, found in introductory statistical texts.)
Data Source: "Water Quality and Supply on Cortina Rancheria, Colusa County, California",
U.S. Geological Survey Water Resources Investigations Report 89-4004.