ABOUT RAINBOW TROUT BIOMETRIC DATA
Rainbow trout taken from 4 different localities along the Spokane River (eastern Washington) during July, August
and October of 1999 were analyzed for heavy metals for the Washington State Department of Ecology. As part of this
study, the length (in millimeters) and weight (in grams) of each trout were measured; age determinations using
scales are currently underway.
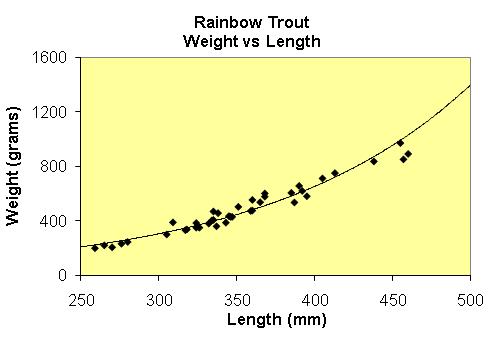
Rainbow trout show an exponential relationship between length and weight. Smaller (younger) fish are relatively
long and skinny, whereas larger (older) fish are much more stout. This type of growth sequence is very common among
many plants and animals; humans show the same kind of growth behavior.
The good fit of an exponential model to the data could be utilized to eliminate weighing the fish; just measure
the length, and calculate the weight from the function.
Reference: Johnson, A. (2000), Results from Analyzing Metals in 1999 Spokane River Fish and Crayfish Samples;
Washington State Dept. of Ecology report.
Web Site: http://www.ecy.wa.gov/biblio/0003017.html