ABOUT YELLOWSTONE NP BISON POPULATION, 1902-1931
Populations of organisms often show an S-shaped growth pattern, where
population grows rapidly in an early stage, then slows to little or
no growth in a later stage. S-shaped or sigmoidal growth can be caused
by a number of factors, however a common interpretation involves an
external limit to growth based on environmental factors. Populations
might be limited to some value (often referred to as the carrying
capacity) because of finite food resources, space, water, etc.
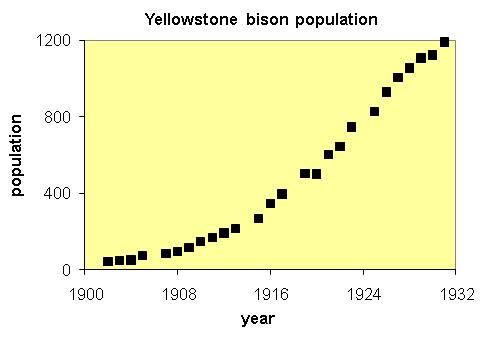
Data on North American bison (aka "buffalo") in Yellowstone
National Park between 1902 and 1931 show an S-shaped curve of population
as a function of time. One might question how these data were obtained,
given the rugged terrain of the park, and at what time or times of
the year (bison often die in the winter and spring). Bison wander
in and out of the park boundaries; is there really a "park population"?
Sigmoidal growth curves are often modeled using a modified exponential
model, the logistic model, where the growth rate decreases as the
population increases. The bison data fit a logistic model very well.
To fit the data with a discrete logistic model, students must determine
reasonable values for the initial population and initial time, the
carrying capacity, and the initial growth rate; none of these parameters
are given in the actual data set.
The bison data suggest a carrying capacity of approximately X for
Yellowstone National Park, however the current bison population is
approximately 2X. Is the model wrong, or did something else happen?
Reference: we have not yet obtained the original citation for these
data. The numbers were found at a Carroll College website devoted
to the Intermath/ILAP project. We highly recommend: http://web.carroll.edu/mvanisko/ilaps/yellowstone.html