|
Download the Data |
Data Set #007
|
|
| About the Data | ||
| View the Data | ||
| Help with Using Data |
| Go to Top | ||||||||||||||||||||||||||||||||||||||||||||||||||||||||||||||||||||||
|
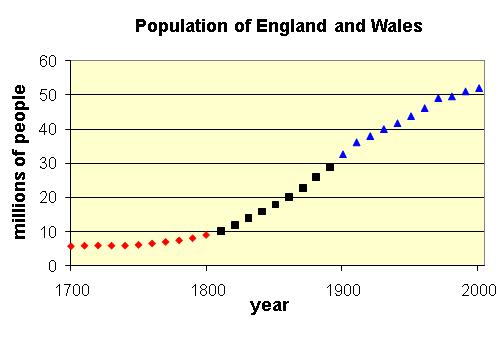
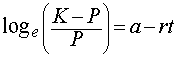
About the Data The empirical study of population in England originated with John Rickman, who laid the groundwork for the first five decadal censuses from 1801 to 1841. These early censuses gathered information from every household in the approximately 11,000 parishes. Information was collected by the Overseers of the Poor (local poverty relief workers throughout England), with help from various officers of the peace. Among the information gathered was the total number of people, as well as the number of people employed in trade, manufacturing and agriculture. In addition, the census of 1801 queried the clergy for the number of baptisms and burials in every tenth year from 1700 to 1800. Rickman used these data to make population projections for those years. A famous contemporary of Rickman was Thomas Malthus, who published in 1798 his Essay on the Principle of Population as it affects the future improvement of society. Thomas caused great concern when he stated that populations grow geometrically (exponentially) and food supplies grow arithmetically (linearly), suggesting that population has an inherent tendency to outstrip resources. Malthus further suggested that an equilibrium between the population and food supply could be reached provided certain "checks" on the population occur: famine, war, and delayed marriage. Thomas' alarmist view of the future caused many Englanders to accept the need for a census. The earliest data presented here (1700-1800) are from G. Talbot Griffith's Population Problems in the Age of Malthus. Apparently Griffith derived these estimates from the 1801 census data, which was compiled by Rickman. The second set of data (1811-1891) is listed in Whitaker's Almanac from 1941; we have no information about the original source of these data, but suppose that they were based upon the UK censuses. The third set of data (1901-2001) were provided by UK National Statistics Online, and should be considered the most reliable of the three data sets. We see that the England and Wales population data exhibit the classic shape of the logistic growth curve. The theoretical model for logistic growth (first established by Verhulst in 1838) assumes that the population rate of change decreases arithmetically as the population grows. In other words, each individual added to the population reduces the rate of increase by an equal amount. The rate of increase then reaches zero when the population reaches the carrying capacity (the maximum level supported by the environment). The logistic growth formula can be written as follows:
In the formula, P = population size at time t, K = carrying capacity of the population, e = 2.718281828 (Euler's constant), a = a constant defining the position of the curve relative to the origin, and r = rate of population growth per capita. The equation above can be rearranged into the following form:
This second equation shows that the left hand side is a linear function of time, which allows one to fit the logistic curve to the actual data. Students should do the following. 1) Estimate K, the carrying capacity, from the data. 2) transform the population values using the left hand side expression. 3) Plot the transformed population values against the year. 4) If the data are close to being logistic, then the plotted data (from the previous step) should be close to linear. Estimate the vertical intercept (a) and slope (-r). 5) The first logistic formula above can now be written using the estimated values for K, a, and r. How well do the England and Wales population data fit a logistic growth model? Data Sources:
|
||||||||||||||||||||||||||||||||||||||||||||||||||||||||||||||||||||||
| Go to Top | ||||||||||||||||||||||||||||||||||||||||||||||||||||||||||||||||||||||
|
View the Data
|
||||||||||||||||||||||||||||||||||||||||||||||||||||||||||||||||||||||
| Go to Top | ||||||||||||||||||||||||||||||||||||||||||||||||||||||||||||||||||||||