These data are derived from the bivariate data listed in QELP
Data Set #001. Please follow this link to learn about butter clam
habitat and life cycle, and how the sample was collected. We feature
the univariate length/width ratio data at this web page to exhibit
how students and educators might transform data sets at the QELP website
into other meaningful data collections.
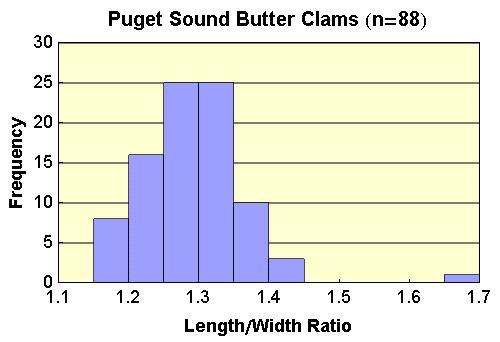
We see that the distribution of the length/width ratios of butter
clams is centered around the mean of 1.28, with one obvious outlier
with a value of 1.67. How many standard deviations above the mean
does this clam lie?
Students might also test the normality of the data by making a normal
quantile or probability plot. A normal quantile plot displays (x,
y) data, where x is the the actual data value, and y
is the z-score of the quantile of x. A normal quantile plot
that is linear indicates that the original data are normally distributed.
You can quickly create a normal quantile plot by launching Webstat
(click on the orange Play Now button above) and then selecting Graphics>QQ
plot.
Students might also consider these questions relating to the physical
meaning of the length/width ratio: What shape does an "average"
clam have? What about the shape of the outlier clam mentioned above?
Does the length/width ratio change as the size of the clam changes?
How can the length/width ratio be visualized in the plot of Data
Set #001? What are the units of measure of the length/width ratio?